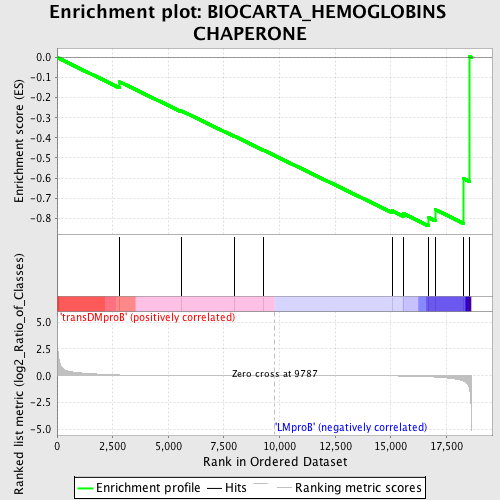
Profile of the Running ES Score & Positions of GeneSet Members on the Rank Ordered List
| Dataset | Set_04_transDMproB_versus_LMproB.phenotype_transDMproB_versus_LMproB.cls #transDMproB_versus_LMproB |
| Phenotype | phenotype_transDMproB_versus_LMproB.cls#transDMproB_versus_LMproB |
| Upregulated in class | LMproB |
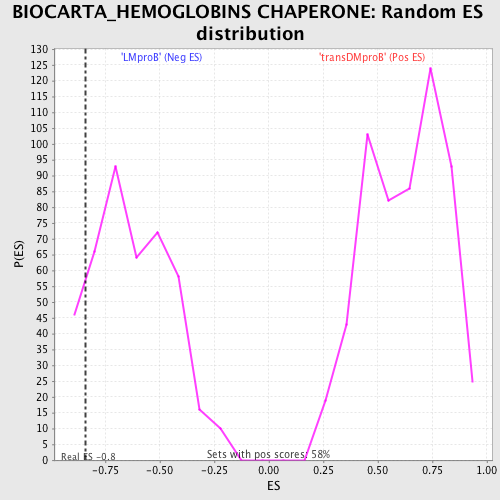
| GeneSet | BIOCARTA_HEMOGLOBINS CHAPERONE |
| Enrichment Score (ES) | -0.8387323 |
| Normalized Enrichment Score (NES) | -1.3436816 |
| Nominal p-value | 0.11529412 |
| FDR q-value | 1.0 |
| FWER p-Value | 1.0 |
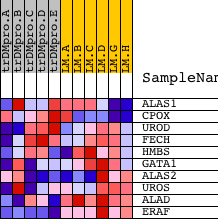
| PROBE | DESCRIPTION (from dataset) | GENE SYMBOL | GENE_TITLE | RANK IN GENE LIST | RANK METRIC SCORE | RUNNING ES | CORE ENRICHMENT | |
|---|---|---|---|---|---|---|---|---|
| 1 | ALAS1 | 19013 | 2816 | 0.068 | -0.1215 | No | ||
| 2 | CPOX | 1740 8780 | 5597 | 0.011 | -0.2659 | No | ||
| 3 | UROD | 15791 | 7954 | 0.004 | -0.3909 | No | ||
| 4 | FECH | 1975 23419 1964 | 9273 | 0.001 | -0.4613 | No | ||
| 5 | HMBS | 19149 3004 49 | 15055 | -0.020 | -0.7630 | No | ||
| 6 | GATA1 | 24196 | 15559 | -0.030 | -0.7770 | No | ||
| 7 | ALAS2 | 24229 | 16709 | -0.093 | -0.7974 | Yes | ||
| 8 | UROS | 17588 1227 | 16999 | -0.125 | -0.7575 | Yes | ||
| 9 | ALAD | 15866 | 18282 | -0.503 | -0.6043 | Yes | ||
| 10 | ERAF | 5034 | 18551 | -1.408 | 0.0035 | Yes |